By Gallery Director Ali Wunder
This creative exercise is all about mapping. Not maps in the conventional sense, but a map of your day to day experience in a time when there is no clear path to normal.
What would a map of your daily movements look like now that you are confined to one place? Do you find yourself moving more, or less? This exercise is a process oriented visualization of how you, and your family members move around your space.
Materials:
Sketchbook or blank sheets of paper
Favorite drawing or painting materials
A ruler (or not)
Draw a blueprint style schematic of your home, or where you are sheltered, including any outside spaces you have access to on a daily basis.
Select a different color for every person and or animal living in your space.
Create a key that displays the colors designated to each person.
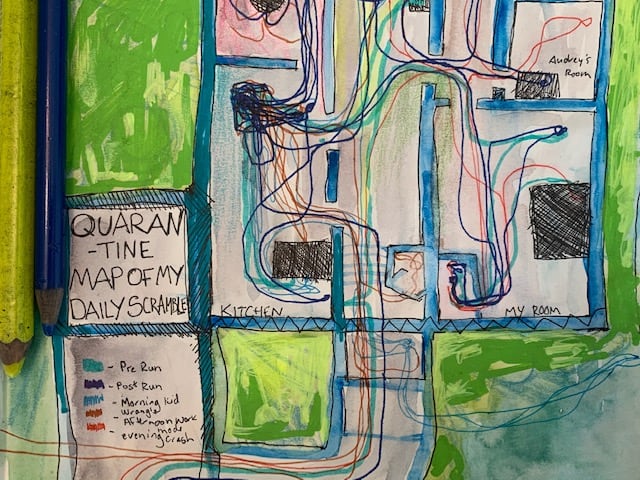
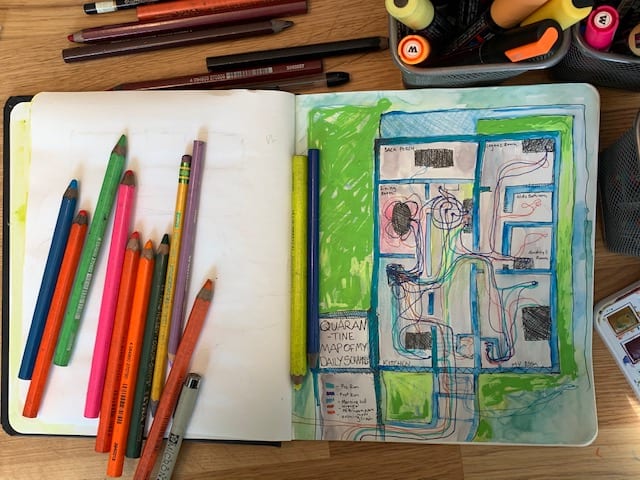
Start with yourself at the beginning of your day and draw a continuous line that represents the path you make in, and around your space each day.
Continue by adding the other members of your household, overlapping lines and colors. Or you could draw your path over the course of a week, with a different color representing each day.
I ended up choosing different colors to represent parts of my day. I find that my time is very compartmentalized now. My mornings are full of kid-centered activities and my afternoons are a flurry of work tasks and domestic chores. This exercise could potentially be the start of an abstract painting, or just a way to reflect on your day.
And while we’re on the subject of maps…
Here are some inspiring, unconventional maps that other artist are making:
Mark Bradford
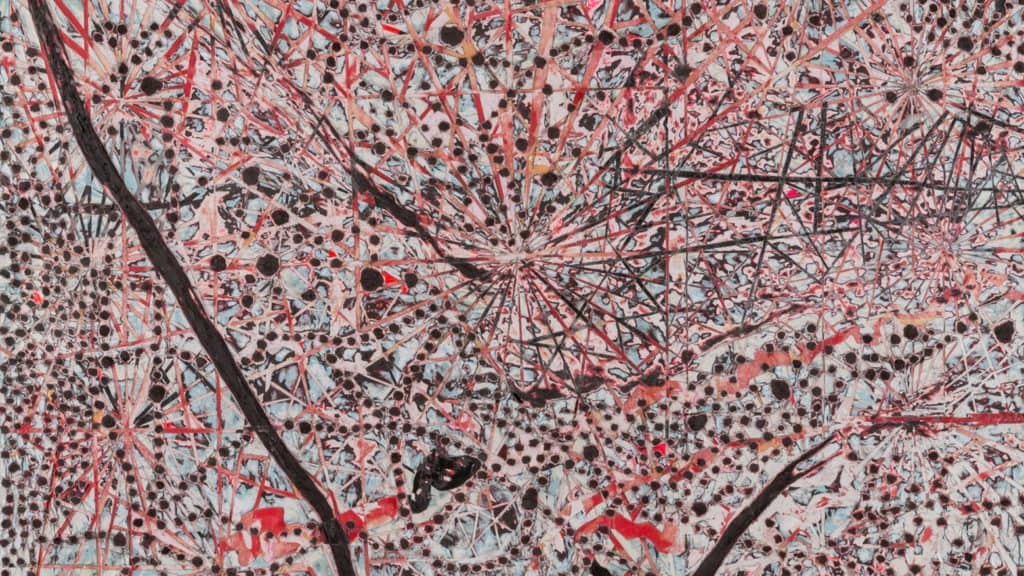
Mark Bradford creates lush abstract paintings that closely resemble maps of his hometown Los Angeles. Bradford constructs his works from signage and other materials found in his old neighborhood that create a physical manifestation of his memories of the place.
Paula Scher
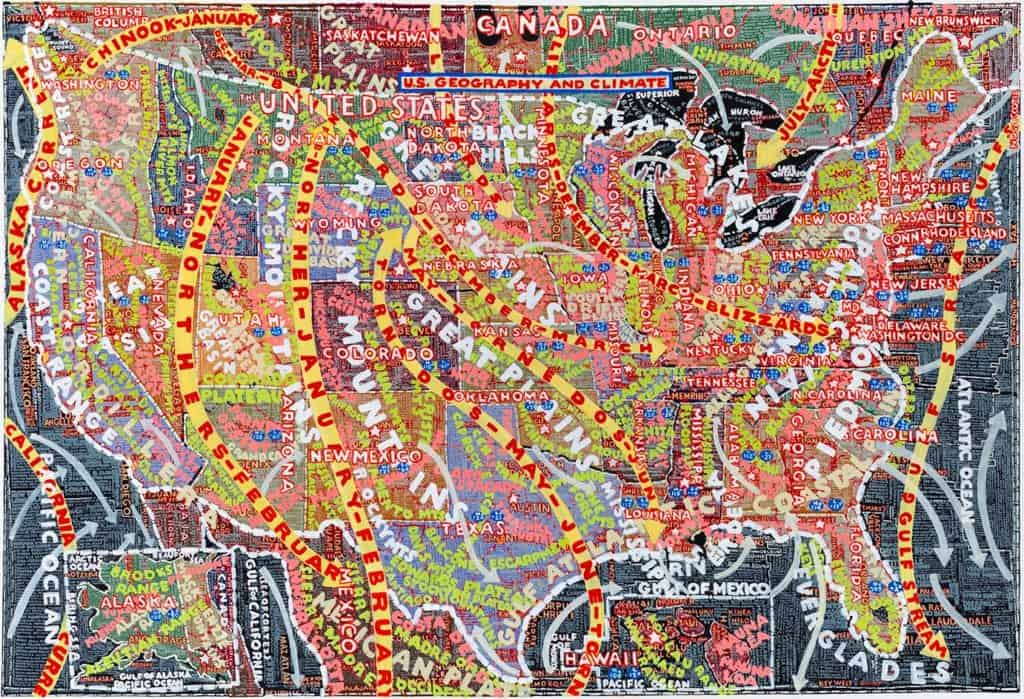
Renowned graphic designer Paula Scher has a series of painted maps that synthesize large bodies of information. In one she creates a map of the united states made entirely of the median home prices of each area and in another, counties and zip codes. She uses text and other typographic elements to construct these massive maps, each giving a different informational lens through which to view the country.
Chris Bonnell
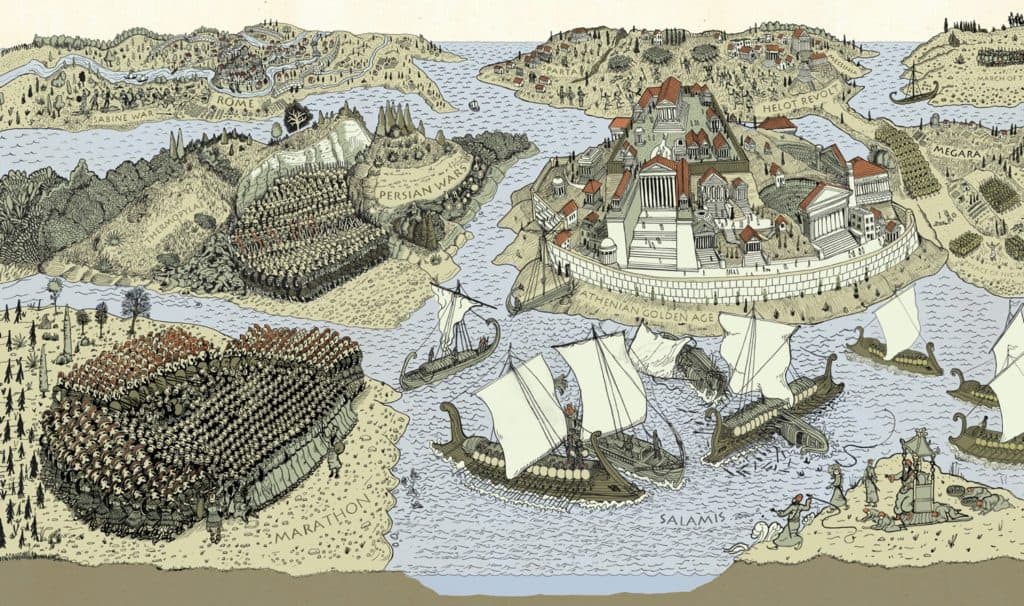
Finally, our very own Chris Bonnell, who teaches illustration at the League School, makes fascinating illustrated maps that plot out historical events.